Deep Sea Fish Oil - Complete lead to Natural Deep Sea Fish Oil
An understanding of the global distribution and temporal trends of atmospheric methyl bromide (CH3Br) is necessary to place constraints on the magnitude and distribution of its sources and sinks. Although evidence suggests that the atmospheric burden of CH3Br increased during the 1980s, its atmospheric mole fraction does not appear to have changed significantly during the past decade. Sources of CH3Br include oceanic production, biomass burning, leaded fuel combustion, plant and marsh emissions, and fumigation of soils, durable goods, perishables, and structures. Sinks include photochemical decomposition in the atmosphere (reaction with hydroxyl radicals (OH) and photolysis at higher altitudes), loss to soils, chemical and biological degradation in the ocean, and uptake by green plants.
The ozone depletion potential (ODP) of CH3Br is a function, in part, of its total atmospheric lifetime. The total atmospheric lifetime, t, is determined by the reciprocal of the sum of the reciprocal partial atmospheric lifetimes with respect to each sink:

A substantial change in the ability of any one of these sinks to remove CH3Br from the atmosphere can result in a change in the atmospheric lifetime and ODP for this trace gas. For example, a reduction in the global OH concentration would result in a longer partial lifetime, tatm, and a larger ODP. The effect of an increase in the sea-surface temperature would be more complicated. Oceanic chemical degradation rates would increase. Alone this would result in a reduction of the partial lifetime, tocn, and subsequently the ODP. However, the effect that the increase in SST might have on the biological production and degradation of CH3Br is not yet known. Global climate change could alter both the lifetime and ODP of this trace gas as well as other trace gases with similarly sensitive sources and sinks. There are studies currently underway that are beginning to examine the potential effect that global change may have on the lifetime and ODP of CH3Br.
Distributions and Trends
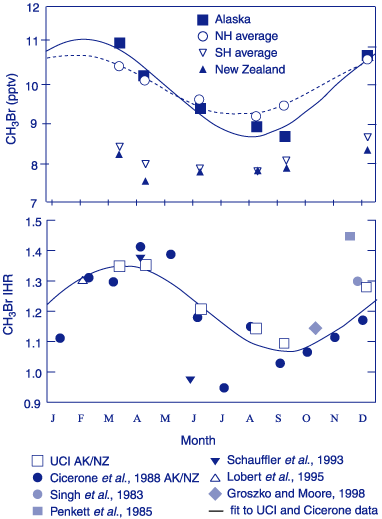
The number of field and monitoring programs that include CH3Br has increased over the past few years. While the techniques and standards used by each investigator differ, recent intercalibrations combined with ambient measurements indicate that the global mean atmospheric mixing ratio for CH3Br is between 9 and 10 pmol mol-1 [Kurylo et al., 1999]. From a number of these field studies, the mean interhemispheric ratio (IHR) is currently estimated at 1.3 ± 0.1. This ratio appears to vary seasonally by about 0.2, driven mainly by variations in the Northern Hemisphere (NH) [Wingenter et al., 1998]. The seasonal cycle observed in the high latitude NH appears consistent with OH seasonal variability, but is much larger than the seasonal cycle present in the SH (Figure 1). This is not consistent with seasonality driven by OH oxidation. It strongly suggests that the variations of CH3Br in the troposphere are modulated in good part by other seasonally varying sources and sinks in one or both hemispheres [Kurylo et al., 1999].

The vertical distribution of CH3Br has been studied both in the lower stratosphere and in the troposphere. Tropospheric levels of CH3Br are typically found near the tropopause as well, although some profiles show a slightly decreased concentration of CH3Br at the highest altitudes. Once CH3Br is in the stratosphere, its mixing ratios drop off rapidly with height, as a significant amount of reactive bromine is released. For some trace gases, vertical profiles in the troposphere may be used to put a lower limit on their lifetimes in the troposphere. A gas with a short atmospheric lifetime relative to the mixing time in the troposphere and having only surface sources should exhibit a tropospheric vertical profile that decreases with increasing altitude. However, once CH3Br and other gases like it that have a relatively long lifetime with respect to gas phase reactions (1.7 y for CH3Br) are released from the surface, they can become well mixed in the troposphere. There may be some near-surface gradients as a result of locally large surface sources or sinks, but this would depend strongly on local mixing and would not affect the calculated lifetime of this gas .
Current monitoring networks did not start measuring CH3Br regularly until just before the anthropogenic production rate was frozen by international agreement. The only long-term record of CH3Br measurements before this period was reported by Khalil et al. and began in 1978 in the NH and in 1983 globally. The mean latitudinally-weighted, global growth rate calculated from these data was 0.15 ± 0.08 pmol mol-1 y-1 between 1983 and 1992. To obtain an idea of the earlier trends of CH3Br in the atmosphere, Butler et al. [1999] measured CH3Br in air that has been trapped in consolidated snow (firn) in Antarctica and Greenland. Although the Greenland data suggested unusual growth of CH3Br in the firn air, which gives rise to questions about the integrity of an atmospheric imprint of this gas in the firn, results from Antarctica showed no signs of this activity. The Antarctic results, taken at face value, suggest that the CH3Br growth rate increased from 0.01 pmol mol-1 y-1 in the early 1900s to 0.05-0.06 (±0.01) pmol mol-1 y-1 during the 1970s and 1980s. The increased growth rate during the 1970's coincides with increasing use of CH3Br as an agricultural fumigant and is consistent with the SH measurements of Khalil et al. [1993] for that period.
Ocean
The ocean acts as both a source and a sink for CH3Br. The net flux of CH3Br across the air-sea interface is controlled by a dynamic balance of in situ production and degradation as well as degradation during mixing out of the surface layer. Results from recent laboratory culture studies suggest that CH3Br is produced by phytoplankton, although other organisms, such as zooplankton and bacteria cannot be ruled out as contributors. Methyl bromide is degraded in seawater via hydrolysis and chloride substitution. It has been shown that CH3Br also undergoes biological degradation in tropical waters, which may be due to bacterial uptake and that these rates are likely significant. Results from field studies, showing large undersaturations in polar and subpolar waters, also suggest a significant biological sink mechanism.
Oceanic Uptake and Emission
Recent laboratory studies have greatly improved the parameterizations for the chemical degradation rate constant, solubility , and diffusion coefficient of CH3Br. Using these results and a 2ºx2º gridded global data set of physical properties of the ocean, Yvon and Butler [1996] calculated a tocn of 2.7 y (2.4 - 6.5 y) for CH3Br. This approach reduced the uncertainty in the Butler [1994] calculation of tocn by including the seasonal and spatial variability of the ocean's physical properties. Nevertheless, significant uncertainties remain in the calculation of oceanic uptake and lifetime. The gas exchange coefficient, which is typically calculated from parameterizations defined by Liss and Merlivat [1986] or Wanninkhof [1992], imparts a factor of two uncertainty on the calculation of lifetime and uptake. Recent results indicate that the known chemical degradation mechanisms are not the only degradation mechanisms for CH3Br in the oceans and make this calculation even more uncertain. Another degradation rate constant term must be included to account for this additional loss pathway. To date, King and Saltzman [1997] have reported the only direct measurement of this additional degradation rate. Moore and Webb [1996], Lobert et al. [1997], and Grosko and Moore [1998] reported indirect evidence for this additional degradation, where the observed saturation anomalies (deviations from air-sea equilibrium) could only be sustained with degradation rates substantially larger than the known chemical degradation rates. Yvon-Lewis and Butler [1997] estimated the magnitude and distribution of biological degradation from these data and recalculated a tocn of 1.85 y (1.1 - 3.9 y), which now includes the additional loss.
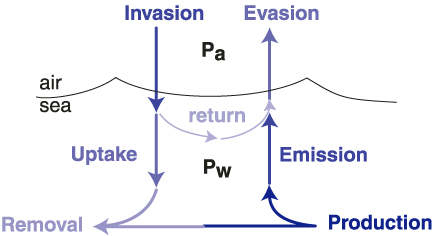
A similar approach can be used to calculate the emission rate (Figure 2) of CH3Br from the ocean to the atmosphere, where emission is defined as the fraction of CH3Br produced in the ocean that reaches the atmosphere before being degraded in the water. Emission is distinct from evasion, as emission does not include the return of gas originating in the atmosphere (Figure 2). (This is similar to uptake and invasion.) While results from recent laboratory culture studies suggest that CH3Br is produced, at least in part, by phytoplankton , the magnitude and distribution of gross production rates for CH3Br are not known. Therefore, it has not been possible to calculate the emission rate directly. Currently, the emission rate must be calculated by difference between the net flux determined from the measured saturation anomaly and the uptake rate calculated using known oceanic degradation mechanisms.

Figure 2. Schematic of the coupled ocean-atmosphere system, where Pa and Pw are the partial pressures of the species of interest in air and in the water. The net flux can be calculated as the difference between evasion and invasion, emission and uptake, or production and removal. The derivation and mathematical expressions for these terms are given in Butler and Rodriguez [1996]. The partial lifetime of atmospheric CH3Br with respect to oceanic loss is calculated from uptake, which is an irreversible loss.
Observations of Net Flux
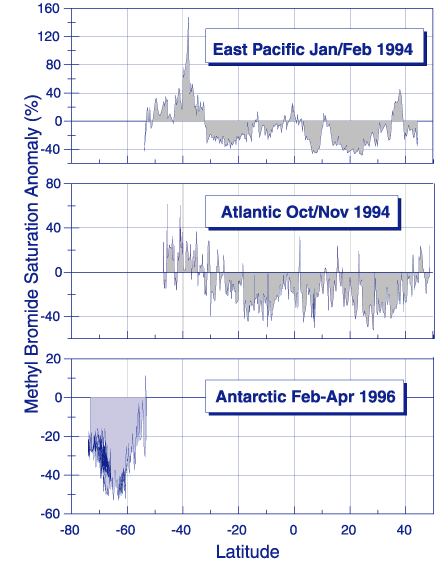
Results from a number of recent research cruises are used to determine the globally averaged net flux of CH3Br across the air-sea interface. The net flux is calculated from the difference in the observed partial pressures of CH3Br in air and dissolved in surface seawater and a calculated gas exchange coefficient. Not too long ago it was thought that the oceans were largely supersaturated in CH3Br. This was noted in the 1994 Scientific Assessment of Ozone Depletion and it indicated that the oceans were a significant net source of CH3Br to the atmosphere. However, recent field studies in the Pacific , the Atlantic, the Labrador Sea, and the Southern Ocean have demonstrated that the oceans are a net sink for CH3Br (Figure 3). The estimated global net flux of -21 Gg y-1 (-11 to -32 Gg y-1) determined by Lobert et al. [1997] includes data from two cruises with long latitudinal transects in both hemispheres in the Atlantic and Pacific Oceans and one cruise in the Southern Ocean. Grosko and Moore [1998] calculated a global net flux of -10 Gg yr-1 (-3 to -13 Gg y-1) from one long transect in the Pacific Ocean and a regional cruise in the Labrador Sea. The Grosko and Moore [1998] studies were conducted at different times of year than that of Lobert et al. [1997], suggesting that seasonality may play a role in modulating the average global net flux. One recent study clearly demonstrated a seasonal cycle in dissolved CH3Br in the shallow waters of the North Sea and from the above studies there is weak evidence for seasonal cycling in temperate waters.

Figure 3. Distribution of the methyl bromide saturation anomaly from Lobert et al.
In attempts to derive the oceanic net flux of CH3Br from differences in aquatic production and degradation, Anbar et al. [1996] and Pilinis et al. [1996] used different models whose results suggest that the high productivity in the high latitude polar waters would result in large supersaturations of CH3Br in these regions. They predicted that polar and subpolar supersaturations were so large (200% - 500%) that the global net ocean-atmosphere flux left the oceans as a significant net source of CH3Br to the atmosphere. To evaluate these predictions, measurements of the CH3Br saturation anomaly (difference from equilibrium) were made in the Southern Ocean in early 1996, and showed a ~35% undersaturation virtually everywhere along the cruise track. This indicated that the polar oceans were a net sink, not a net source of CH3Br. Moore and Webb [1996] and Grosko and Moore [1998] obtained similar results for work in the Labrador Sea and northern Atlantic Ocean. The most recent Scientific Assessment on Ozone Depletion has adopted the -21 Gg y-1 from Lobert et al. [1997] as the current best estimate for the oceanic net flux of CH3Br, but has expanded the uncertainty to include measurements of Groszko and Moore [1998]. This leaves a possible range of -3 to -32 Gg y-1.
Oceanic Impact on Atmospheric Budget
A summary of the CH3Br budget adopted by the most recent WMO Scientific Assessment for Ozone Depletion: [Kurylo et al., 1999] is shown in Table 1. Since the assessment was finalized, additional research has generated emission estimates for some newly discovered, terrestrial sources of CH3Br. The results from some of these recent studies are also shown in Table 1. Gan et al. [1998] suggested that the global emission rate from the rapeseed plant alone is 7 Gg y-1. From a study of salt marshes, Rhew et al. [1999] estimated that 10% (~14 Gg y-1) of the total CH3Br global emissions emanated from that source. Varner et al. [1999b], measuring the flux of CH3Br from a fen and a bog in New Hampshire, put the global emission rate from wetlands at 4.6 Gg y-1. An additional small source flux has been observed from rice fields, 1.5 Gg y-1. The emission of CH3Br from the fungal decomposition of woody litter has been calculated at 1.7 Gg y-1 using a model and assuming that the CH3Br production parallels methyl chloride production .
 Deep Sea Crabs